
Topics

Research experience in labor markets, youth, education, and migration. Working with household surveys from Colombia and Latin America.

For technical and non-technical audiences. Publication-ready visualizations in ggplot2 and Plotly. Currently studying D3.js to create interactive web visualizations.

Experience in youth and education policy evaluation.

Tools

Python
R
Stata
SAS
Streamlit
Power BI
QGIS
Git
Illustrator

Recent projects

I currently work with youth social data in Bogota, designing dashboards and reports for operational and public policy teams. Here I share some aggregated outputs and personal projects.
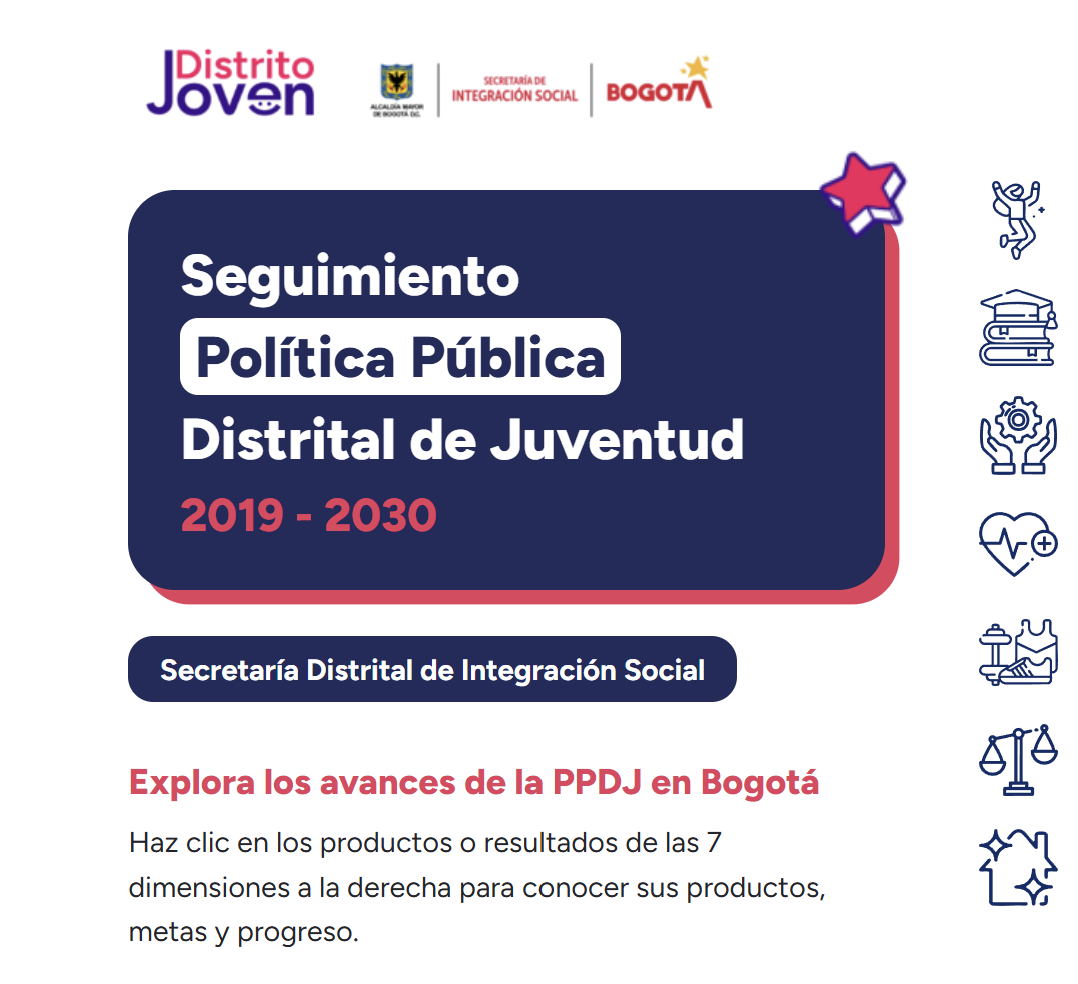
Knowledge management system for SDIS

System to organize, document and visualize the work of the Youth Subdirectorate of the District Secretariat of Social Integration.

PythonDashboardSDISKnowledge management

Information dashboards for the Youth Subdirectorate

I design information dashboards for the Youth Subdirectorate of the District Secretariat of Social Integration. Each one answers a different question: where to prioritize, how the media talks about youth, and how the youth public policy is progressing.
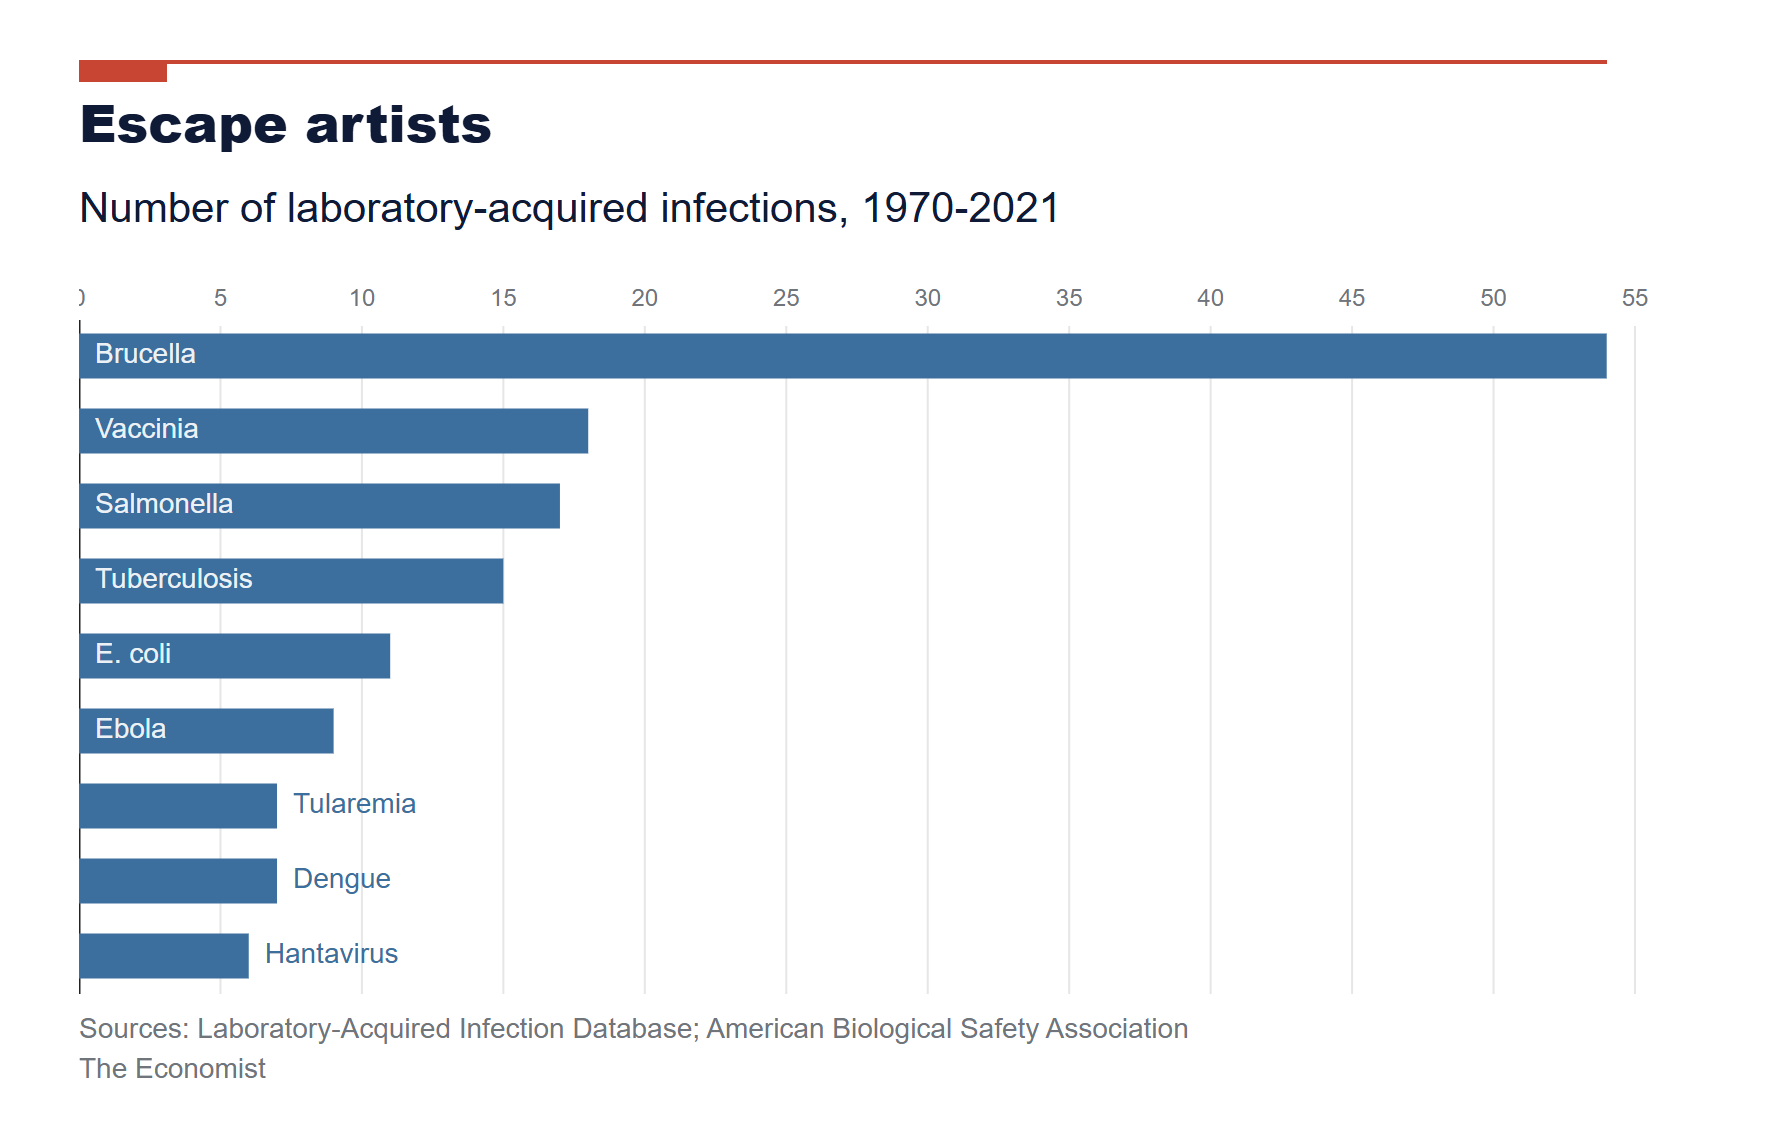
StreamlitGitHub PagesSDISYouth

D3 and React course notebook

Learning D3 and React, the gold standard for interactive data visualization. Public notebook with course projects, learning notes, and personal variations.
ReactD3.jsGitHub PagesPersonal

Previous projects

Selected work from previous roles, where I worked on data analysis and evaluation of education and labor policies for institutions across Latin America.

Remote tutoring impact evaluation in Latin America

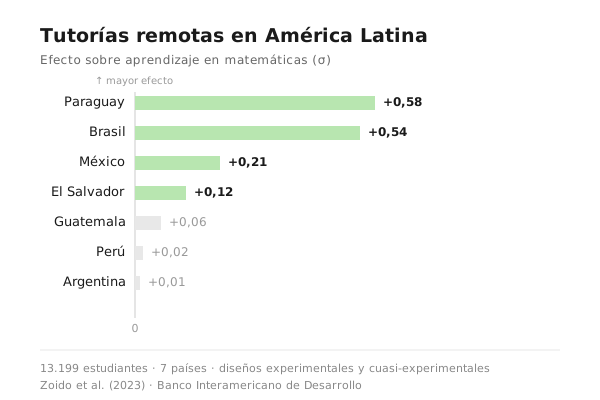
Multi-country evaluation of remote tutoring programs to accelerate math learning across seven Latin American countries, combining experimental and quasi-experimental designs adapted to each context. Worked alongside in-country implementers on data analysis and monitoring. Conducted at the Inter-American Development Bank (IDB).

D3.jsImpact evaluationIDBLACEducation